

This application note presents the electrochemical detection of copper ions (Cu²⁺) using differential pulse voltammetry (DPV), a highly sensitive technique for trace-level analysis in environmental and industrial samples. Using the Medpstat electrochemical workstation, the study demonstrates accurate and reproducible detection of Cu²⁺ in the micromolar concentration range. The method evaluates key analytical parameters such as stability, sensitivity, and reproducibility, ensuring reliable performance for routine electrochemical analysis. In addition, the limit of detection (LOD) and limit of quantitation (LOQ) are determined to assess the system’s precision in trace metal analysis. The results highlight the robustness of the Medpstat, making it a suitable solution for heavy metal detection, water quality monitoring, and industrial applications.
Introduction:
Monitoring heavy metals, especially copper ions (Cu²⁺), is crucial in environmental electrochemistry, industrial process monitoring, and public health applications. Elevated copper levels in water and soil can be toxic, making accurate trace copper detection essential for regulatory compliance and quality assurance. Among analytical methods, electrochemical techniques such as differential pulse voltammetry (DPV) are highly valued for their sensitivity, rapid response, and reliable quantitative analysis of metal ions at low concentrations.
This application note demonstrates the electrochemical detection and quantification of Cu²⁺ ions at micromolar levels (5, 10, 30, 50, and 100 µM) using DPV measurements. The method is extended to determine an unknown Cu²⁺ sample, showcasing practical quantitative analysis. Key metrics like the limit of detection (LOD) and limit of quantitation (LOQ) are assessed to highlight the method’s analytical performance, signal resolution, and reproducibility. These results confirm the robustness of DPV-based electrochemical methods for trace copper analysis in environmental and industrial settings.
What You Will Learn from This Application Note
- Why Choose Differential Pulse Voltammetry (DPV) Techniques?
- What does the supporting electrolyte do?
- Why are LOD and LOQ important in ion detection?
Principle:
Differential Pulse Voltammetry (DPV) is an advanced electroanalytical technique in which small voltage pulses are applied over a gradually increasing potential. The current is measured before and after each pulse, and the difference (i₁ – i₂) is plotted against potential. By minimizing background currents, DPV produces sharp, well-defined peaks that are directly proportional to analyte concentration. This provides high sensitivity and resolution, making DPV ideal for trace-level copper ion (Cu²⁺) detection and heavy metal analysis in environmental and industrial samples.
Reagents:
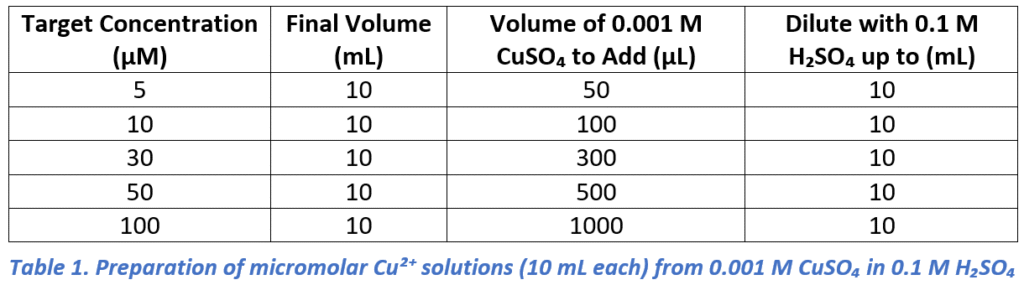
Working solutions of Cu²⁺ (5, 10, 30, 50, and 100 µM) were prepared in 0.1 M H₂SO₄ by diluting a 0.001 M CuSO₄ stock solution. For each case, the required stock volume (N1) was calculated using V1N1=V2N2, where V1=0.001 M, V2=5–100 µM, and N2= 10mL. The required stock volumes for 10 mL of each concentration are summarized in Table 1.
Why is the supporting electrolyte H2SO4, and not PBS?
An acidic supporting electrolyte (0.1 M H₂SO₄) was chosen instead of PBS because acidic media provide higher conductivity and maintain Cu²⁺ ions in a stable, free form. This leads to sharper, more intense, and reproducible DPV peaks, enhancing the sensitivity and accuracy of copper ion detection. In contrast, PBS at neutral pH exhibits lower conductivity, broader peak shapes, and can cause Cu²⁺ speciation, which reduces the analytical performance of the electrochemical method. Using an acidic electrolyte ensures reliable and precise trace copper analysis in environmental and industrial applications.
Apparatus:
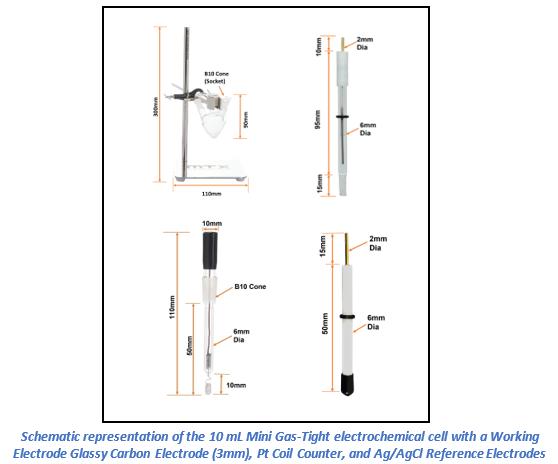
Electrochemical measurements were performed using the MedPstat portable potentiostat operated via MedEplot software (Windows compatible). A conventional three-electrode configuration was employed in a Mini Gas-Tight Cell 10ml (MTX Labs, India), comprising a Glassy Carbon (3mm) as working electrode, an Ag/AgCl Reference Electrode (6 mm diameter), and a Platinum Coil Counter Electrode (30 mm length). Electrodes were rinsed with deionized water and wiped before use. Connections to the potentiostat were made as follows: working electrode (red), reference electrode (blue), counter electrode (black), and sensing (red).
Parameters:
Result and Discussion:
A 200 µM CuSO₄ solution was freshly prepared by dissolving CuSO₄·5H₂O in 0.1 M H₂SO₄, which served as the supporting electrolyte. Before each measurement, the Glassy Carbon Electrode (GCE) was polished using a 0.05 µm alumina slurry on a brown microcloth pad and then rinsed thoroughly with deionized water, followed by gentle drying. This procedure ensured a clean, reproducible, and well-defined electrode surface for reliable measurements.
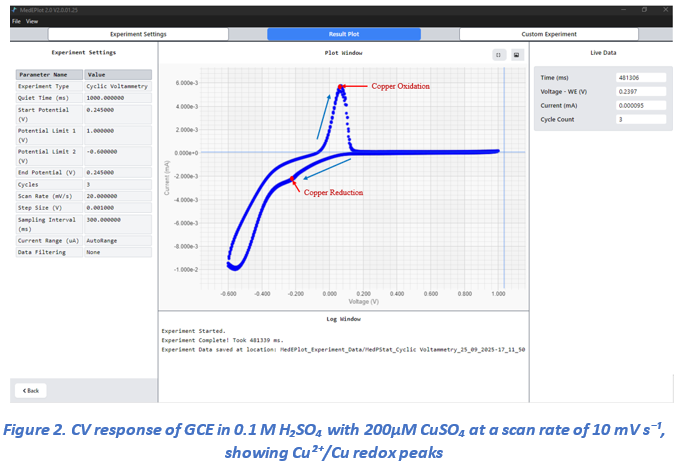
Cyclic voltammetry (CV) was performed within a potential window of +1.0 V to –0.6 V at a scan rate of 50 mV/s (Figure 2). The CV curve clearly revealed the electrochemical behavior of copper: a distinct anodic peak corresponding to copper oxidation was observed at approximately +0.1 V, and a cathodic peak associated with copper reduction appeared at –0.5 V. Beyond –0.6 V, water reduction was evident. These results confirm the successful detection of copper redox activity in the electrolyte.
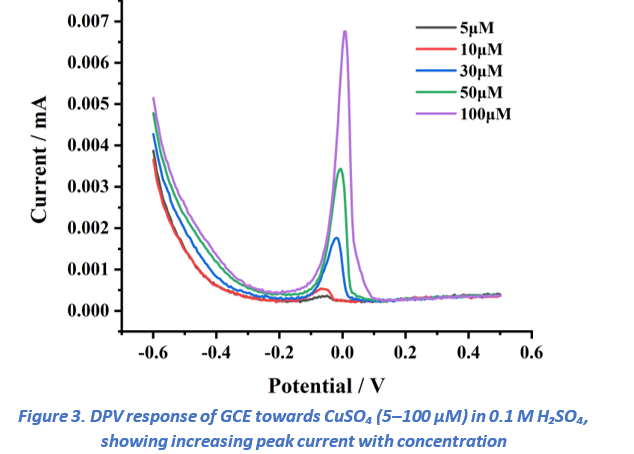
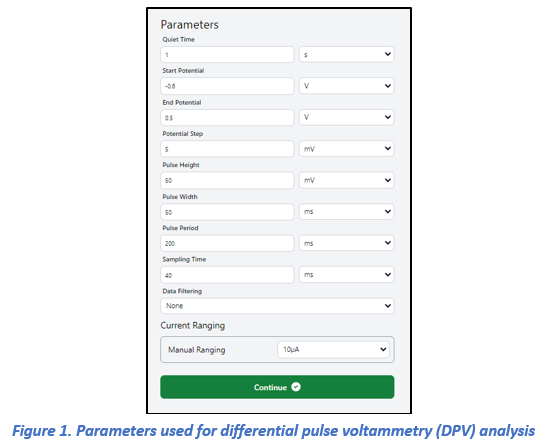
Differential pulse voltammetry (DPV) measurements were conducted for copper ion concentrations in the range of 5–100 µM (Figure 3). The voltammograms displayed a distinct anodic peak at approximately 0.1 V, which can be attributed to the oxidation of copper. The peak current exhibited a linear dependence on concentration, confirming a clear concentration-dependent electrochemical response. As expected, the 100 µM solution produced the highest current signal, while progressively lower concentrations yielded proportionally smaller peak intensities. The DPV experiments were carried out under the following conditions: quiet time, 1 s; potential window, –0.6 to 0.5 V with a step increment of 5 mV. These optimized parameters provided stable baselines and highly reproducible responses, thereby enabling sensitive detection of Cu²⁺ (detailed parameter settings are presented in Figure 1).
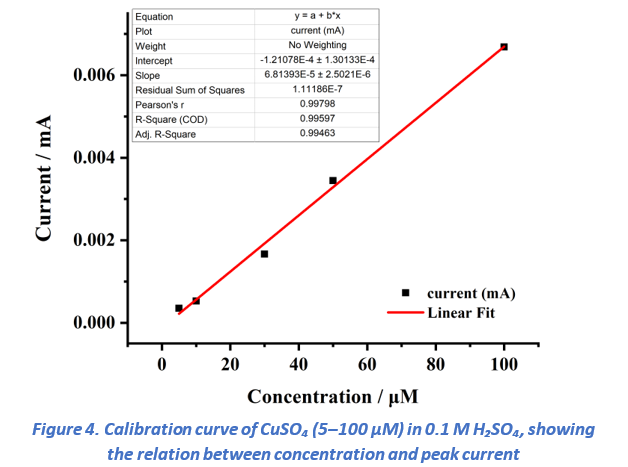
To evaluate analytical performance, the peak currents obtained from DPV (Figure 2) were extracted and plotted against concentration (Figure 4). A linear regression fit was applied. The resulting calibration curve exhibited excellent linearity with a correlation coefficient (R²) of 0.99. and the slope along with the standard deviation of the response were used to calculate the limit of detection (LOD) and limit of quantification (LOQ).
The limit of detection (LOD) and limit of quantification (LOQ) were calculated using the following standard formulas:

Where,
σ: Standard deviation of the blank
S: Slope of the calibration curve
LOD (3.3): Detectable signal ~3× noise (~99% confidence)
LOQ (10): Quantifiable signal ~10× noise for reliable measurement

The calibration analysis showed a limit of detection (LOD) of approximately 1.0 ppm and a limit of quantification (LOQ) of approximately 4.8 ppm for CuSO₄ in 0.1 M H₂SO₄. These results demonstrate that the developed electrochemical detection method for copper ions is highly sensitive, enabling trace copper detection (~1 ppm) using a bare glassy carbon electrode (GCE) without any surface modification. Reliable copper quantification was achieved at concentrations above 3 ppm, with solutions of 4.8 ppm (30 µM) and higher exhibiting well-defined and proportional electrochemical responses. Notably, even at lower concentrations of 0.8 ppm (5 µM) and 1.6 ppm (10 µM), distinct copper signals were observed, confirming the method’s effectiveness for electrochemical trace copper analysis.
Conclusion:
The developed electrochemical method demonstrates high sensitivity for copper detection using a plain glassy carbon electrode without any special surface treatment, achieving a limit of detection (LOD) of approximately 1.6 ppm and a limit of quantification (LOQ) of approximately 4.8 ppm. The key to this performance is the MedPStat potentiostat, which enables measurements to be conducted easily, accurately, and reliably. Even at low concentrations, clear copper signals were observed, confirming the method’s capability for trace-level detection. Furthermore, combining the MedPStat with surface modifications or nanostructured electrodes could further enhance sensitivity, potentially reaching sub-ppm or nanomolar detection levels. This simple yet powerful approach highlights the method’s strong potential for environmental monitoring and trace metal analysis.
Thanks for choosing MedPstat as your research companion.
MTX Labs Team